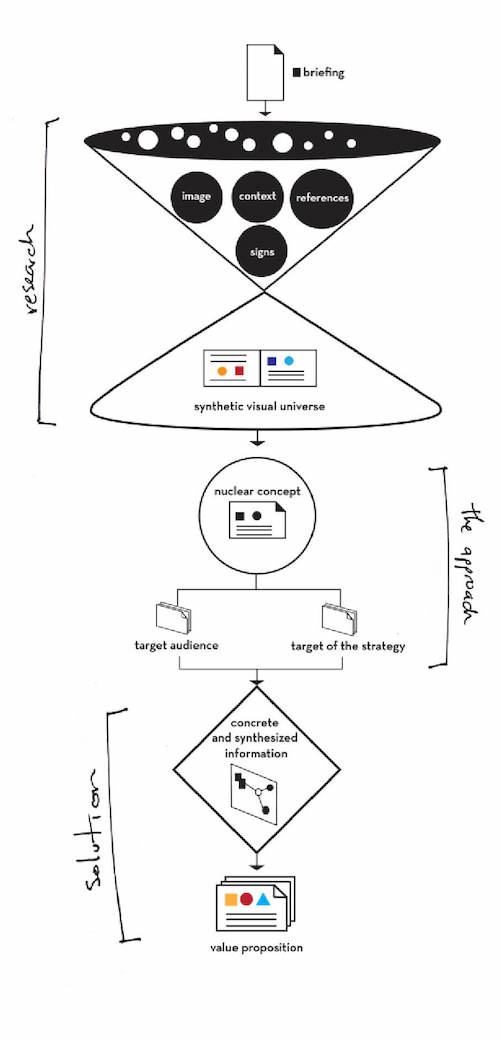
We are currently immersed in a sea of data that does not necessarily turn into information. Data needs to be filtered, decrypted, refined and processed in order to be turned into some kind of information. Upon this universe of data consumption we live within the paradoxes of scarcity to overabundance and move from addition to filtering. The approach needs to move from acquisition to discernment, from research to pattern recognition.
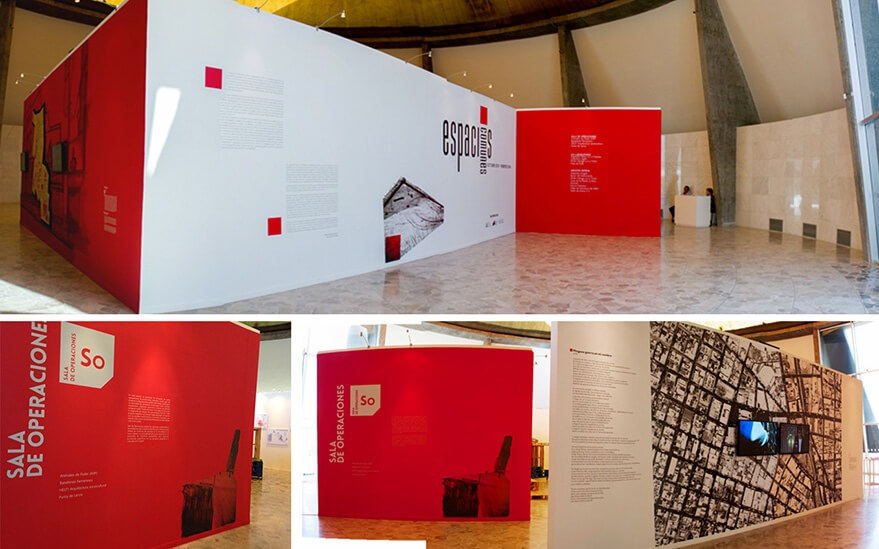
One of the tools within visual communication for this are infographics.
Infographics predate writing as a means of disseminating information - cave drawings are probably the first known example. People were creating and using maps before the advent of written language. In this line of thought, we can say that at the same time visual thought gestated. Visual thinking is the way we classify our mental images using shapes, lines, colours and composition to make them meaningful.
Visual learning consists of two components: the process of becoming aware of the meaning of visual elements and the process of learning how to use visual representations effectively.
We identified two hindrances for data communicators to use visual elements effectively: (1) the visual material is typically treated as a complement rather than an integrated part of the whole and (2) there is a lack of identification of target audiences and refinement of the visual elements for them specifically.
This is why we focus our creative process on perceptual learning. Perceptual learning is a faculty that we have so primary that we forget about it. It’s the same we used as children to differentiate the letter U from V or the A from the B. The beauty of such learning is that it is automatic; there is no thought involved. "Perceptual learning is self-regulating, in the sense that modification occurs without the need for external reinforcement. It is oriented to stimuli, with the aim of extracting and reducing the necessary information" (Eleanor J. Gibson, 1969).
Perceptual learning is always active. Our eyes are constantly looking for the right clues, without extra effort required. We have to pay attention, of course, but there is no need to turn on or adjust the system. It corrects itself, it refines itself. The brain works to find the most significant images and filter out the rest.